Jquery ile grafik oluşturma ( Highcharts )
4 Şubat 2021 / 13:02
Burak
Merhabalar,
Sizlere de lazım olabilir diye jquery ( highcharts ) ile kopyala yapıştır şeklinde kodu sizlerle paylaşıyorum
|
1 2 3 4 5 6 7 8 9 10 11 12 13 14 15 16 17 18 19 20 21 22 23 24 25 26 27 28 29 30 31 32 33 34 35 36 37 38 39 40 41 42 43 44 45 46 47 48 49 50 51 |
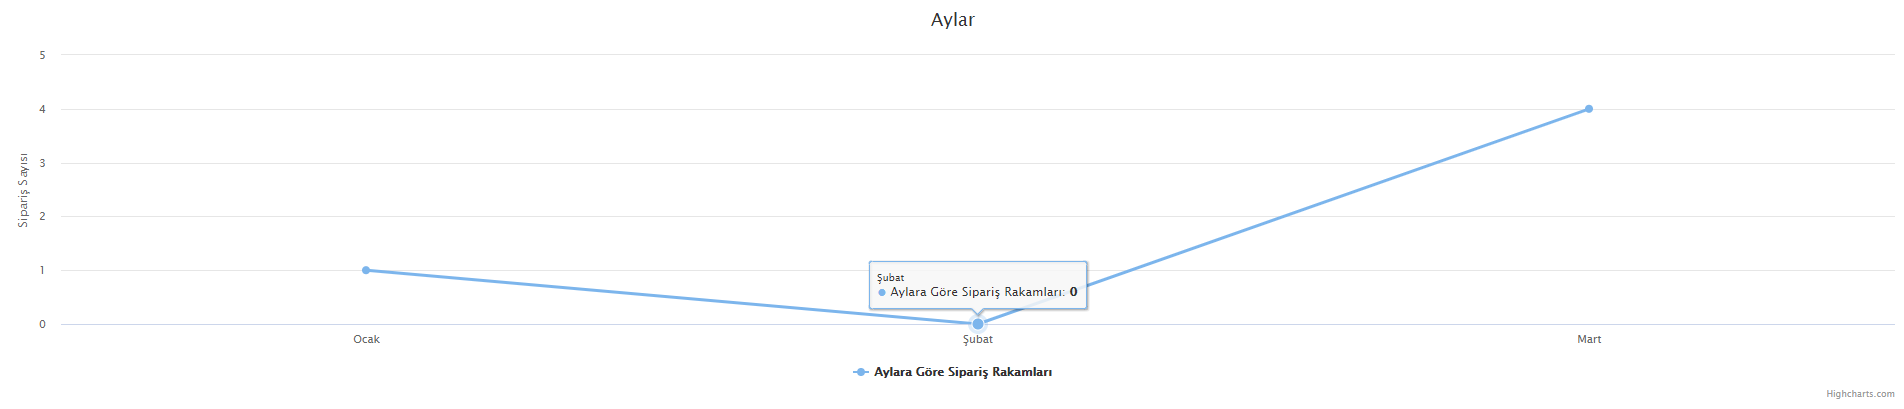
<!DOCTYPE html> <html xmlns="http://www.w3.org/1999/xhtml"> <head runat="server"> <title></title> <script src="https://code.highcharts.com/highcharts.js"></script> </head> <body> <form id="form1" runat="server"> <div> <div id="container" style="width:100%; height:400px;"></div> <script> document.addEventListener('DOMContentLoaded', function () { const chart = Highcharts.chart('container', { chart: { type: 'line' }, title: { text: 'Aylar' }, xAxis: { categories: ['Ocak', 'Şubat', 'Mart', 'Nisan', 'Mayıs', 'Haziran', 'Temmuz', 'Ağustos', 'Eylül', 'Ekim', 'Kasım', 'Aralık'] }, yAxis: { title: { text: 'Sipariş Sayısı' } }, series: [{ name: 'Aylara Göre Sipariş Rakamları', data: [1, 0, 4] } ] }); }); let chart; // globally available document.addEventListener('DOMContentLoaded', function () { chart = Highcharts.stockChart('container', { rangeSelector: { selected: 1 }, series: [{ name: 'USD to EUR', data: usdtoeur // predefined JavaScript array }] }); }); </script> </div> </form> </body> </html> |
Siz kendinize göre özelleştirebilirsiniz. Grafik çıktısı ise aşağıdaki gibidir.
Jquery ile grafik oluşturma ( Highcharts )
Bu Yazılarıda Okuyabilirsiniz...
Bir yanıt yazın